
Power BI – Business Intelligence like never before
Overview
Data is a dynamic variable in businesses. The numbers grow by leaps and bounds here. And that is what concerns the BI world the most. With ever-increasing digits, there is a need for a seamless infrastructure that can provide a greater insight into the data and can provide more yet simple visualizations.
This is where Power BI comes into the picture.
What is Power BI?
Power BI is an ecosystem that integrates already existing corporate BI with self-service BI. In simpler words, it is an analytics tool that allows you to visualize your data and deliver the insights throughout the organization. It lets you connect data from various sources, simplify the data prep, carry out an ad-hoc analysis and bring your reports to life with live dashboards and reports.
Key features of Power BI
Get started easily
Get registered and start using Power BI within seconds. Power BI is free to use. Simply sign up with your company email and you are ready for monitoring your data. Keep in mind that Power BI does not allow personal email ids like Gmail, Yahoo or Hotmail for registration.
If you have an account in Microsoft 365, then its credentials are sufficient to access Power BI. No need to sign up separately then.
Any data, anytime, anywhere
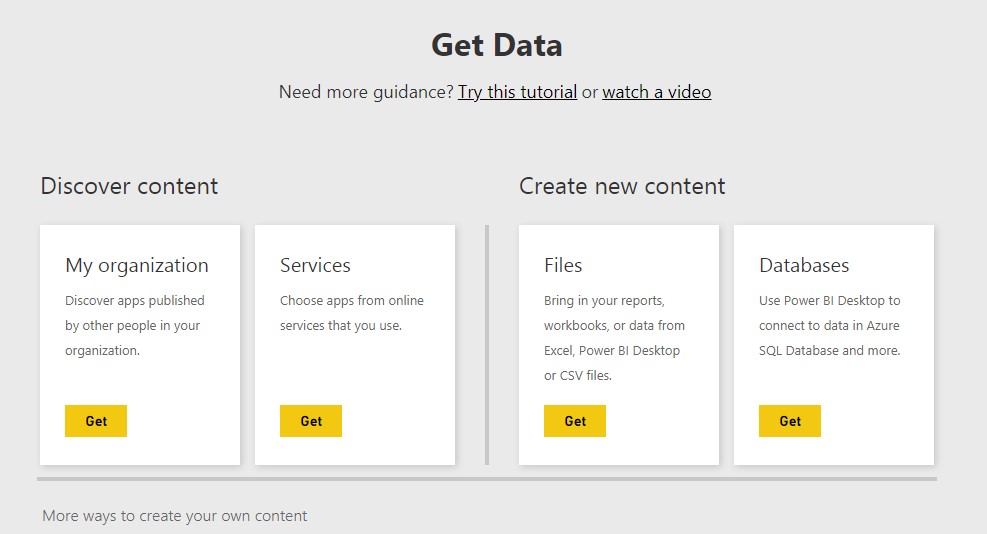
No matter where your data resides, whether it is on the cloud, on-premise databases, Excel Spreadsheets or streaming data, it is accessible in whatever form it is with Power BI.
Power BI can connect with around 60 software solutions and can pull data to a centralized dashboard.
Some of the services, to name a few, to which Power BI can connect are:
- Google Analytics
- JIRA
- Sales Analytics for Dynamics 365
- Microsoft Azure Enterprise
- GitHub
- MailChimp
- Acumatica
- Spark
- Twilio
- Zendesk
Stay on time, be informed
With Power BI real-time dashboards, you can instantly know when your business needs your attention. Power BI uses your data to produce predictive outcomes for your business. This way you can know the potential issues and can take corrective steps that can lead you to the right path to achieve your goals.
Get answers to your questions
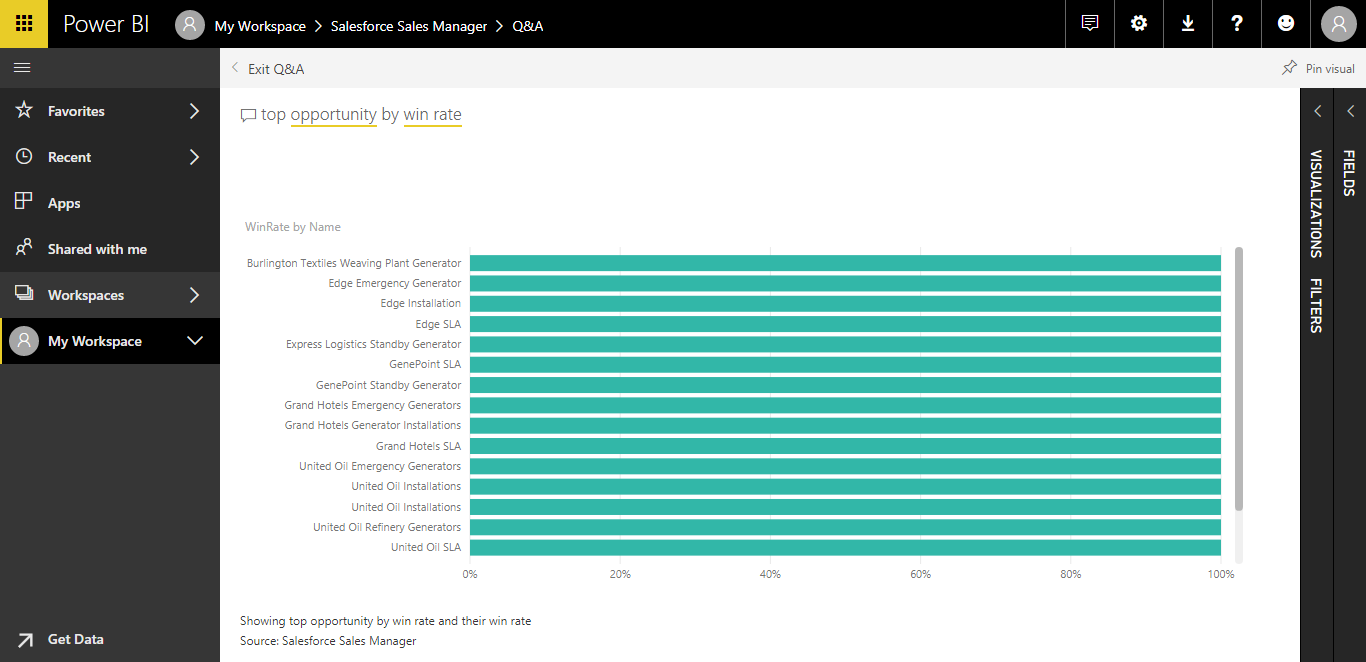
Imagine asking a question like “What was the last year sales by product brand?” and getting a detailed and interactive visualization as an answer. Sounds amazing right? Well, that is very much possible with Power BI. Power BI uses a feature called “Natural Language Queries” wherein you can ask any question in a lucid English language and can get super-fast answers in the form of graphs and charts which you can pin to your dashboard for further use. You don’t need any coding or syntax skills to use this feature.
Automatically search datasets for hidden and quick insights
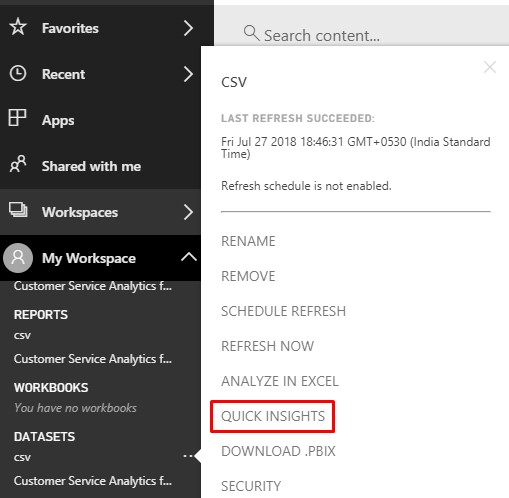
Power BI auto searches all your data and provides hidden insights that might be useful to you. Right click on the dataset and then clicking quick insights, will give you a thorough analysis of your data.
Custom Visualizations
Power BI offers a variety of visualization options for creating reports. You can select the type of the visualization that suits the best for your analysis. You can also add filters to obtain specific reports.
Visual Interactions
Power BI facilitates visual interactions feature to provide a deeper understanding of your data. Visual interactions highlight the relative contribution of the filtered item against the grand total.
Access and stores a vast amount of data from anywhere
Power BI has impressive compression abilities which let you view, analyze and visualize a vast amount of data. There is no need of cutting down large datasets into smaller ones. With Power BI’s strong compression algorithms, it is easy to import and cache the data within .PBIX file.
Share your data story on your website or blog
Connect your data sources, create stunning and interactive visualizations and embed your story on your website or blog within minutes with Power BI publish to web feature. Let your data story reach to a million of users at any place and on any device.
Robust Access Control & Security
Power BI provides row-level security which restricts the data access to your team on a very controlled level. This means that you can control which members of a team or an organization can access specific rows of the data. This not only makes the data secure but also saves the time. You can create just one report and control the access of the data. It also helps the team members as they can see the data related to them and don’t have to filter all the data records.
Another major point of Power BI’s security is content packs. Content packs are used by the users without accessing the database. This means that they can access only the charts and graphs built from the data but cannot manipulate the raw data.
How to use Power BI?
Power BI is available in two forms:
- As a desktop application – Power BI Desktop
- As a cloud based service which is accessible through a web browser – Power BI
Both the platforms are similar and are able to perform the same operations with some subtle differences. Power BI Desktop is normally used to carry out some advanced tasks and supports more data sources services as compared to Power BI.
You can use sign up for Power BI at https://powerbi.microsoft.com/en-us/
And can download the desktop application at https://powerbi.microsoft.com/en-us/desktop/
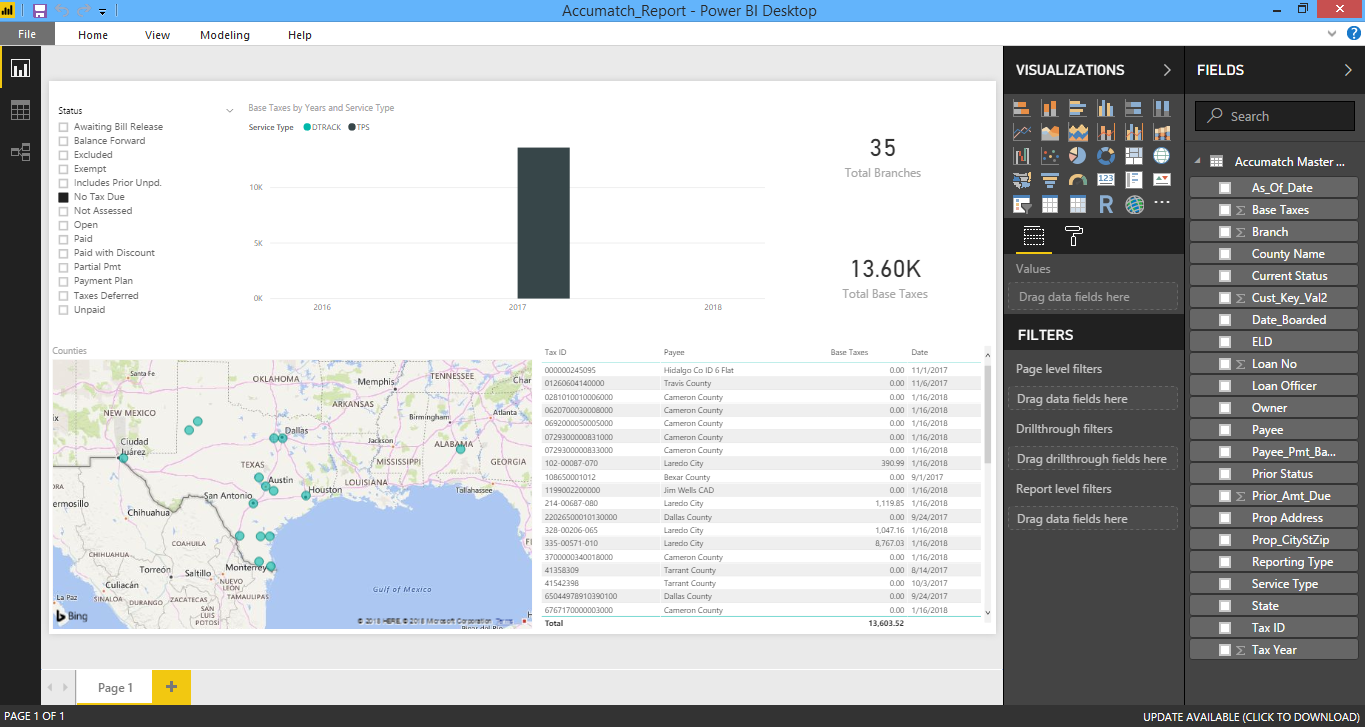
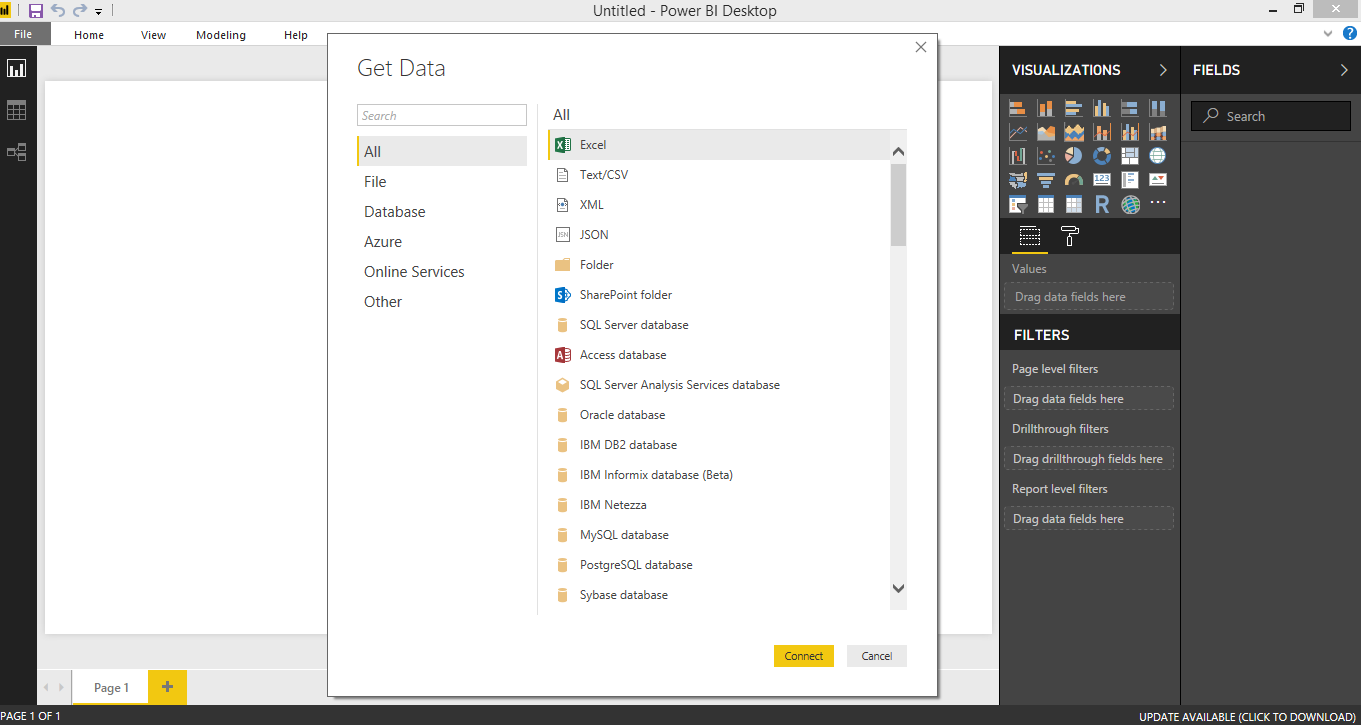
A Power BI Desktop application looks like below
Conclusion
Power BI is an easy-to-use tool and if used effectively can help the organizations to improve their business intelligence. It can propel organizations to a data-driven culture and get deeper insights into the business metrics. It is surely a revolution in the Business Intelligence field and a boon to BI enthusiasts.
Related Post



-
F
-
A
-
Q
Power BI is a business intelligence and analytics platform that helps organizations connect, analyze, visualize, and share data from different sources. It combines existing corporate BI capabilities with self-service analytics so users can gain meaningful insights without depending entirely on technical teams. Businesses can use interactive dashboards and reports to better understand performance and make more informed decisions.
Power BI can connect to a wide range of data sources, including cloud services, on-premise databases, Excel spreadsheets, and streaming data. It can integrate with various platforms and services such as Google Analytics, JIRA, Microsoft Azure, GitHub, MailChimp, Twilio, and Zendesk. This allows organizations to bring information from different systems together and analyze it through centralized dashboards.
Power BI real-time dashboards allow businesses to monitor important information and identify situations that may require immediate attention. By presenting continuously updated data through interactive visualizations, users can track business performance and respond to changing conditions more quickly. The platform can also help identify potential trends and issues so organizations can take corrective action.
Natural Language Queries allow users to ask questions about their data using simple everyday language instead of writing code or complex queries. For example, users can ask questions about sales performance and receive answers through interactive charts and graphs. These visual results can also be pinned to dashboards, making it easier for business users to explore data and obtain insights quickly.
Quick Insights is a Power BI feature that automatically analyzes datasets to identify potentially useful patterns and hidden insights. Users can select a dataset and request quick insights instead of manually examining every part of the data. This can help businesses discover trends, relationships, and unusual patterns that might otherwise be difficult to identify.
Power BI provides multiple visualization options that allow users to represent business information through charts, graphs, dashboards, and interactive reports. Users can select suitable visualizations and apply filters to focus on specific parts of their data. Features such as visual interactions also help users understand relationships and the contribution of individual data points compared with overall results.
Power BI provides access control features such as row-level security, which allows organizations to control which data specific users or teams can access. This means a single report can be shared while different users are shown only the information relevant to them. Power BI also supports content packs, allowing users to work with prepared charts and visualizations without directly accessing or manipulating the underlying raw database.
Power BI is available as Power BI Desktop, a desktop application, and Power BI Service, a cloud-based platform that can be accessed through a web browser. Both provide capabilities for working with data, reports, and visualizations, although Power BI Desktop is generally used for more advanced development and supports additional data-source capabilities. Organizations can use the two platforms together to prepare, analyze, publish, and share business intelligence reports.
Want to Scale Your Business? Let’s Meet & Discuss!

CANADA
30 Eglinton Ave W Mississauga, Ontario L5R 3E7

INDIA
3rd floor Purusharth Plaza, Amin Marg, Rajkot, Gujarat. 360002
INDIA
1116, Zion Z1, Sindhu Bhavan Marg, Nr. Maple County Road, Bodakdev, Ahmedabad, Gujarat. 380059
Get a Quote Now
Let's delve into a thorough understanding of your challenges and explore potential solutions together